4.5. Pandas#
%config InlineBackend.figure_format = 'retina'
import numpy as np
import pandas as pd
from matplotlib import pyplot as plt
from matplotlib import rcParams

# We need to do it in a separate cell. See:
# https://github.com/jupyter/notebook/issues/3385
plt.style.use('default')
rcParams.update({'font.size':12})
4.5.1. Basic Usage#
Iris data is one of the typical statistical sample used by statisticians. See this wikipedia

iris = pd.read_csv('https://raw.githubusercontent.com/mwaskom/seaborn-data/master/iris.csv')
print(f"{type(iris) = }")
type(iris) = <class 'pandas.core.frame.DataFrame'>
iris.head()
| sepal_length | sepal_width | petal_length | petal_width | species | |
|---|---|---|---|---|---|
| 0 | 5.1 | 3.5 | 1.4 | 0.2 | setosa |
| 1 | 4.9 | 3.0 | 1.4 | 0.2 | setosa |
| 2 | 4.7 | 3.2 | 1.3 | 0.2 | setosa |
| 3 | 4.6 | 3.1 | 1.5 | 0.2 | setosa |
| 4 | 5.0 | 3.6 | 1.4 | 0.2 | setosa |
iris.tail(6)
| sepal_length | sepal_width | petal_length | petal_width | species | |
|---|---|---|---|---|---|
| 144 | 6.7 | 3.3 | 5.7 | 2.5 | virginica |
| 145 | 6.7 | 3.0 | 5.2 | 2.3 | virginica |
| 146 | 6.3 | 2.5 | 5.0 | 1.9 | virginica |
| 147 | 6.5 | 3.0 | 5.2 | 2.0 | virginica |
| 148 | 6.2 | 3.4 | 5.4 | 2.3 | virginica |
| 149 | 5.9 | 3.0 | 5.1 | 1.8 | virginica |
iris.describe()
| sepal_length | sepal_width | petal_length | petal_width | |
|---|---|---|---|---|
| count | 150.000000 | 150.000000 | 150.000000 | 150.000000 |
| mean | 5.843333 | 3.057333 | 3.758000 | 1.199333 |
| std | 0.828066 | 0.435866 | 1.765298 | 0.762238 |
| min | 4.300000 | 2.000000 | 1.000000 | 0.100000 |
| 25% | 5.100000 | 2.800000 | 1.600000 | 0.300000 |
| 50% | 5.800000 | 3.000000 | 4.350000 | 1.300000 |
| 75% | 6.400000 | 3.300000 | 5.100000 | 1.800000 |
| max | 7.900000 | 4.400000 | 6.900000 | 2.500000 |
You can save by .to_csv(), print to html by to_html(), convert to numpy by .to_numpy(), etc:
# iris.to_csv("iris_data.csv")
# iris.to_html()
# iris.to_numpy()
4.5.2. Selection of Columns and Rows#
If you select a column or a row, it now becomes pandas.Series, not DataFrame:
sep_len = iris["sepal_length"]

print(type(sep_len))
sep_len.head()
<class 'pandas.core.series.Series'>
0    5.1
1    4.9
2    4.7
3    4.6
4    5.0
Name: sepal_length, dtype: float64
Convert to numpy:
sep_len.to_numpy()
# Identical to sep_len.values
array([5.1, 4.9, 4.7, 4.6, 5. , 5.4, 4.6, 5. , 4.4, 4.9, 5.4, 4.8, 4.8,
       4.3, 5.8, 5.7, 5.4, 5.1, 5.7, 5.1, 5.4, 5.1, 4.6, 5.1, 4.8, 5. ,
       5. , 5.2, 5.2, 4.7, 4.8, 5.4, 5.2, 5.5, 4.9, 5. , 5.5, 4.9, 4.4,
       5.1, 5. , 4.5, 4.4, 5. , 5.1, 4.8, 5.1, 4.6, 5.3, 5. , 7. , 6.4,
       6.9, 5.5, 6.5, 5.7, 6.3, 4.9, 6.6, 5.2, 5. , 5.9, 6. , 6.1, 5.6,
       6.7, 5.6, 5.8, 6.2, 5.6, 5.9, 6.1, 6.3, 6.1, 6.4, 6.6, 6.8, 6.7,
       6. , 5.7, 5.5, 5.5, 5.8, 6. , 5.4, 6. , 6.7, 6.3, 5.6, 5.5, 5.5,
       6.1, 5.8, 5. , 5.6, 5.7, 5.7, 6.2, 5.1, 5.7, 6.3, 5.8, 7.1, 6.3,
       6.5, 7.6, 4.9, 7.3, 6.7, 7.2, 6.5, 6.4, 6.8, 5.7, 5.8, 6.4, 6.5,
       7.7, 7.7, 6. , 6.9, 5.6, 7.7, 6.3, 6.7, 7.2, 6.2, 6.1, 6.4, 7.2,
       7.4, 7.9, 6.4, 6.3, 6.1, 7.7, 6.3, 6.4, 6. , 6.9, 6.7, 6.9, 5.8,
       6.8, 6.7, 6.7, 6.3, 6.5, 6.2, 5.9])
4.5.3. Selecting Elements (.loc and .iloc)#
Two major ways to select elements:
locis used when you want to use column name and row index.loc[column, i], such asiris.loc["sepal_length", 0]
ilocis used when you want to use integer indexing.iloc[i, j], such asiris.iloc[0, 1]oriris.iloc[-1]
# To select only one:
print(f"{iris.iloc[0, 1]            = }")
print(f"{iris.loc[0, 'sepal_width'] = }")
iris.iloc[0, 1]            = 3.5
iris.loc[0, 'sepal_width'] = 3.5
# Select a row by iloc
iris.iloc[0, :]
sepal_length       5.1
sepal_width        3.5
petal_length       1.4
petal_width        0.2
species         setosa
Name: 0, dtype: object
# Select a row by loc:
iris.loc[0]
sepal_length       5.1
sepal_width        3.5
petal_length       1.4
petal_width        0.2
species         setosa
Name: 0, dtype: object
row_0 = iris.iloc[0]

print(type(row_0))
row_0
<class 'pandas.core.series.Series'>
sepal_length       5.1
sepal_width        3.5
petal_length       1.4
petal_width        0.2
species         setosa
Name: 0, dtype: object
And when converting the Series obejct to numpy.ndarray:
iris["petal_length"].values
array([1.4, 1.4, 1.3, 1.5, 1.4, 1.7, 1.4, 1.5, 1.4, 1.5, 1.5, 1.6, 1.4,
       1.1, 1.2, 1.5, 1.3, 1.4, 1.7, 1.5, 1.7, 1.5, 1. , 1.7, 1.9, 1.6,
       1.6, 1.5, 1.4, 1.6, 1.6, 1.5, 1.5, 1.4, 1.5, 1.2, 1.3, 1.4, 1.3,
       1.5, 1.3, 1.3, 1.3, 1.6, 1.9, 1.4, 1.6, 1.4, 1.5, 1.4, 4.7, 4.5,
       4.9, 4. , 4.6, 4.5, 4.7, 3.3, 4.6, 3.9, 3.5, 4.2, 4. , 4.7, 3.6,
       4.4, 4.5, 4.1, 4.5, 3.9, 4.8, 4. , 4.9, 4.7, 4.3, 4.4, 4.8, 5. ,
       4.5, 3.5, 3.8, 3.7, 3.9, 5.1, 4.5, 4.5, 4.7, 4.4, 4.1, 4. , 4.4,
       4.6, 4. , 3.3, 4.2, 4.2, 4.2, 4.3, 3. , 4.1, 6. , 5.1, 5.9, 5.6,
       5.8, 6.6, 4.5, 6.3, 5.8, 6.1, 5.1, 5.3, 5.5, 5. , 5.1, 5.3, 5.5,
       6.7, 6.9, 5. , 5.7, 4.9, 6.7, 4.9, 5.7, 6. , 4.8, 4.9, 5.6, 5.8,
       6.1, 6.4, 5.6, 5.1, 5.6, 6.1, 5.6, 5.5, 4.8, 5.4, 5.6, 5.1, 5.1,
       5.9, 5.7, 5.2, 5. , 5.2, 5.4, 5.1])
4.5.4. Selecting by Conditions#
When making a new DataFrame using a subset of the columns of an existing DataFrame:
iris2 = iris.loc[iris["species"] == "versicolor"].copy()
# I always recommend you to use .copy() at the end, if you don't know what it means.
iris2.head()
| sepal_length | sepal_width | petal_length | petal_width | species | |
|---|---|---|---|---|---|
| 50 | 7.0 | 3.2 | 4.7 | 1.4 | versicolor |
| 51 | 6.4 | 3.2 | 4.5 | 1.5 | versicolor |
| 52 | 6.9 | 3.1 | 4.9 | 1.5 | versicolor |
| 53 | 5.5 | 2.3 | 4.0 | 1.3 | versicolor |
| 54 | 6.5 | 2.8 | 4.6 | 1.5 | versicolor |
iris2 = iris.loc[(iris["petal_length"] > 5) & (iris["species"] == "versicolor")].copy()
# I always recommend you to use .copy() at the end, if you don't know what it means.
iris2.head()
| sepal_length | sepal_width | petal_length | petal_width | species | |
|---|---|---|---|---|---|
| 83 | 6.0 | 2.7 | 5.1 | 1.6 | versicolor |
Note that you have to use parentheses like .loc[(condition1) & (condition2)].
4.5.5. Iterate through the DataFrame#
In the example below, I tried to add a column named “test” while iterating through the rows:
for i, row in iris.iterrows():
    if i == 0:
        print(i)
        print(row)
        row["test"] = 999
        print()
        print(row)
0
sepal_length       5.1
sepal_width        3.5
petal_length       1.4
petal_width        0.2
species         setosa
Name: 0, dtype: object

sepal_length       5.1
sepal_width        3.5
petal_length       1.4
petal_width        0.2
species         setosa
test               999
Name: 0, dtype: object
print(iris.iloc[0])
# Note that it is not changed!
sepal_length       5.1
sepal_width        3.5
petal_length       1.4
petal_width        0.2
species         setosa
Name: 0, dtype: object
How do we modify them actually?
A not working example:
# Initialize
iris["test"] = None
for i, row in iris.iterrows():
    row.loc["test"] = row["sepal_length"] + row["petal_length"]
Here, row is just a copy of the original DataFrame. So nothing is changed in iris:
iris.head(1)
| sepal_length | sepal_width | petal_length | petal_width | species | test | |
|---|---|---|---|---|---|---|
| 0 | 5.1 | 3.5 | 1.4 | 0.2 | setosa | None |
A working example:
You need to directly access to the original DataFrame:
# Initialize
iris["test"] = None
for i, row in iris.iterrows():
    iris.at[i, "test"] = row["sepal_length"] + row["petal_length"]
iris.head(1)
| sepal_length | sepal_width | petal_length | petal_width | species | test | |
|---|---|---|---|---|---|---|
| 0 | 5.1 | 3.5 | 1.4 | 0.2 | setosa | 6.5 |
Things go well in this case with loc, but I used at.
locis slower, but you can access to multiple locationsatis quicker, but you can access to only one single location
See here
A working and good example for this specific case:
But in this kind of simple summation case, you can just do
iris["test"] = iris["sepal_length"] + iris["petal_length"]
iris.head(1)
| sepal_length | sepal_width | petal_length | petal_width | species | test | |
|---|---|---|---|---|---|---|
| 0 | 5.1 | 3.5 | 1.4 | 0.2 | setosa | 6.5 |
You don’t even need that initialization.
The iteration is useful when you do some complicated jobs:
# Initialize
iris["test"] = None
for i, row in iris.iterrows():
    length_sum = row["sepal_length"] + row["petal_length"]
    if length_sum > 0.1:
        length_sum = 0.1
    iris.at[i, "test"] = length_sum
4.5.6. Drop#
pandas usually generate annoying index (0, 1, ..., N) columns etc. You can drop them by
iris = iris.drop(columns=["test"])

iris.head(1)
| sepal_length | sepal_width | petal_length | petal_width | species | |
|---|---|---|---|---|---|
| 0 | 5.1 | 3.5 | 1.4 | 0.2 | setosa |
NaN’s can be removed by .dropna():
iris_nan = iris.copy()
iris_nan.iloc[:2] = None
iris_nan.head()
| sepal_length | sepal_width | petal_length | petal_width | species | |
|---|---|---|---|---|---|
| 0 | NaN | NaN | NaN | NaN | None |
| 1 | NaN | NaN | NaN | NaN | None |
| 2 | 4.7 | 3.2 | 1.3 | 0.2 | setosa |
| 3 | 4.6 | 3.1 | 1.5 | 0.2 | setosa |
| 4 | 5.0 | 3.6 | 1.4 | 0.2 | setosa |
iris_nan = iris_nan.dropna()
iris_nan.head()  # try .reset_index() by yourself
| sepal_length | sepal_width | petal_length | petal_width | species | |
|---|---|---|---|---|---|
| 2 | 4.7 | 3.2 | 1.3 | 0.2 | setosa |
| 3 | 4.6 | 3.1 | 1.5 | 0.2 | setosa |
| 4 | 5.0 | 3.6 | 1.4 | 0.2 | setosa |
| 5 | 5.4 | 3.9 | 1.7 | 0.4 | setosa |
| 6 | 4.6 | 3.4 | 1.4 | 0.3 | setosa |
iris_nan.reset_index().head()
| index | sepal_length | sepal_width | petal_length | petal_width | species | |
|---|---|---|---|---|---|---|
| 0 | 2 | 4.7 | 3.2 | 1.3 | 0.2 | setosa |
| 1 | 3 | 4.6 | 3.1 | 1.5 | 0.2 | setosa |
| 2 | 4 | 5.0 | 3.6 | 1.4 | 0.2 | setosa |
| 3 | 5 | 5.4 | 3.9 | 1.7 | 0.4 | setosa |
| 4 | 6 | 4.6 | 3.4 | 1.4 | 0.3 | setosa |
iris_nan.reset_index(drop=True).head()
| sepal_length | sepal_width | petal_length | petal_width | species | |
|---|---|---|---|---|---|
| 0 | 4.7 | 3.2 | 1.3 | 0.2 | setosa |
| 1 | 4.6 | 3.1 | 1.5 | 0.2 | setosa |
| 2 | 5.0 | 3.6 | 1.4 | 0.2 | setosa |
| 3 | 5.4 | 3.9 | 1.7 | 0.4 | setosa |
| 4 | 4.6 | 3.4 | 1.4 | 0.3 | setosa |
# iris_nan.to_csv("test.csv", index=False)
4.5.7. Sorting#
iris.sort_values(by=["sepal_width", "petal_length"]).head()
| sepal_length | sepal_width | petal_length | petal_width | species | |
|---|---|---|---|---|---|
| 60 | 5.0 | 2.0 | 3.5 | 1.0 | versicolor |
| 62 | 6.0 | 2.2 | 4.0 | 1.0 | versicolor |
| 68 | 6.2 | 2.2 | 4.5 | 1.5 | versicolor |
| 119 | 6.0 | 2.2 | 5.0 | 1.5 | virginica |
| 41 | 4.5 | 2.3 | 1.3 | 0.3 | setosa |
As can be seen, the index numbers are kept but “ordered” based on the column.
Reset it:
iris_sort = (iris.sort_values(by="sepal_width")
             .reset_index(drop=True)
)
iris_sort.head()
| sepal_length | sepal_width | petal_length | petal_width | species | |
|---|---|---|---|---|---|
| 0 | 5.0 | 2.0 | 3.5 | 1.0 | versicolor |
| 1 | 6.0 | 2.2 | 4.0 | 1.0 | versicolor |
| 2 | 6.0 | 2.2 | 5.0 | 1.5 | virginica |
| 3 | 6.2 | 2.2 | 4.5 | 1.5 | versicolor |
| 4 | 4.5 | 2.3 | 1.3 | 0.3 | setosa |
See what happens if drop = False.
4.5.8. Grouping#
Grouping is one of the most useful functionality of pandas.
grouped = iris.groupby("species")
print(type(grouped))
<class 'pandas.core.groupby.generic.DataFrameGroupBy'>
grouped.get_group("setosa").head(1)
| sepal_length | sepal_width | petal_length | petal_width | species | |
|---|---|---|---|---|---|
| 0 | 5.1 | 3.5 | 1.4 | 0.2 | setosa |
for name, group in grouped:
    print(name)
    print(group.describe())
    print()
setosa
       sepal_length  sepal_width  petal_length  petal_width
count      50.00000    50.000000     50.000000    50.000000
mean        5.00600     3.428000      1.462000     0.246000
std         0.35249     0.379064      0.173664     0.105386
min         4.30000     2.300000      1.000000     0.100000
25%         4.80000     3.200000      1.400000     0.200000
50%         5.00000     3.400000      1.500000     0.200000
75%         5.20000     3.675000      1.575000     0.300000
max         5.80000     4.400000      1.900000     0.600000

versicolor
       sepal_length  sepal_width  petal_length  petal_width
count     50.000000    50.000000     50.000000    50.000000
mean       5.936000     2.770000      4.260000     1.326000
std        0.516171     0.313798      0.469911     0.197753
min        4.900000     2.000000      3.000000     1.000000
25%        5.600000     2.525000      4.000000     1.200000
50%        5.900000     2.800000      4.350000     1.300000
75%        6.300000     3.000000      4.600000     1.500000
max        7.000000     3.400000      5.100000     1.800000

virginica
       sepal_length  sepal_width  petal_length  petal_width
count      50.00000    50.000000     50.000000     50.00000
mean        6.58800     2.974000      5.552000      2.02600
std         0.63588     0.322497      0.551895      0.27465
min         4.90000     2.200000      4.500000      1.40000
25%         6.22500     2.800000      5.100000      1.80000
50%         6.50000     3.000000      5.550000      2.00000
75%         6.90000     3.175000      5.875000      2.30000
max         7.90000     3.800000      6.900000      2.50000
4.5.9. Masking and Special Operations#
mask = iris["sepal_width"] < 3.3
iris.loc[mask].head()  # Try .reset_index() by yourself
| sepal_length | sepal_width | petal_length | petal_width | species | |
|---|---|---|---|---|---|
| 1 | 4.9 | 3.0 | 1.4 | 0.2 | setosa |
| 2 | 4.7 | 3.2 | 1.3 | 0.2 | setosa |
| 3 | 4.6 | 3.1 | 1.5 | 0.2 | setosa |
| 8 | 4.4 | 2.9 | 1.4 | 0.2 | setosa |
| 9 | 4.9 | 3.1 | 1.5 | 0.1 | setosa |
There are many of the things you can do for str, e.g., .split or .replace, etc.
You can do that on all the strs in a column without for loop in pandas:
setosa_mask = iris["species"].str.startswith("seto")
iris.loc[setosa_mask].head()
| sepal_length | sepal_width | petal_length | petal_width | species | |
|---|---|---|---|---|---|
| 0 | 5.1 | 3.5 | 1.4 | 0.2 | setosa |
| 1 | 4.9 | 3.0 | 1.4 | 0.2 | setosa |
| 2 | 4.7 | 3.2 | 1.3 | 0.2 | setosa |
| 3 | 4.6 | 3.1 | 1.5 | 0.2 | setosa |
| 4 | 5.0 | 3.6 | 1.4 | 0.2 | setosa |
iris["species"].str.replace("seto", "testingtesting").head()
0    testingtestingsa
1    testingtestingsa
2    testingtestingsa
3    testingtestingsa
4    testingtestingsa
Name: species, dtype: object
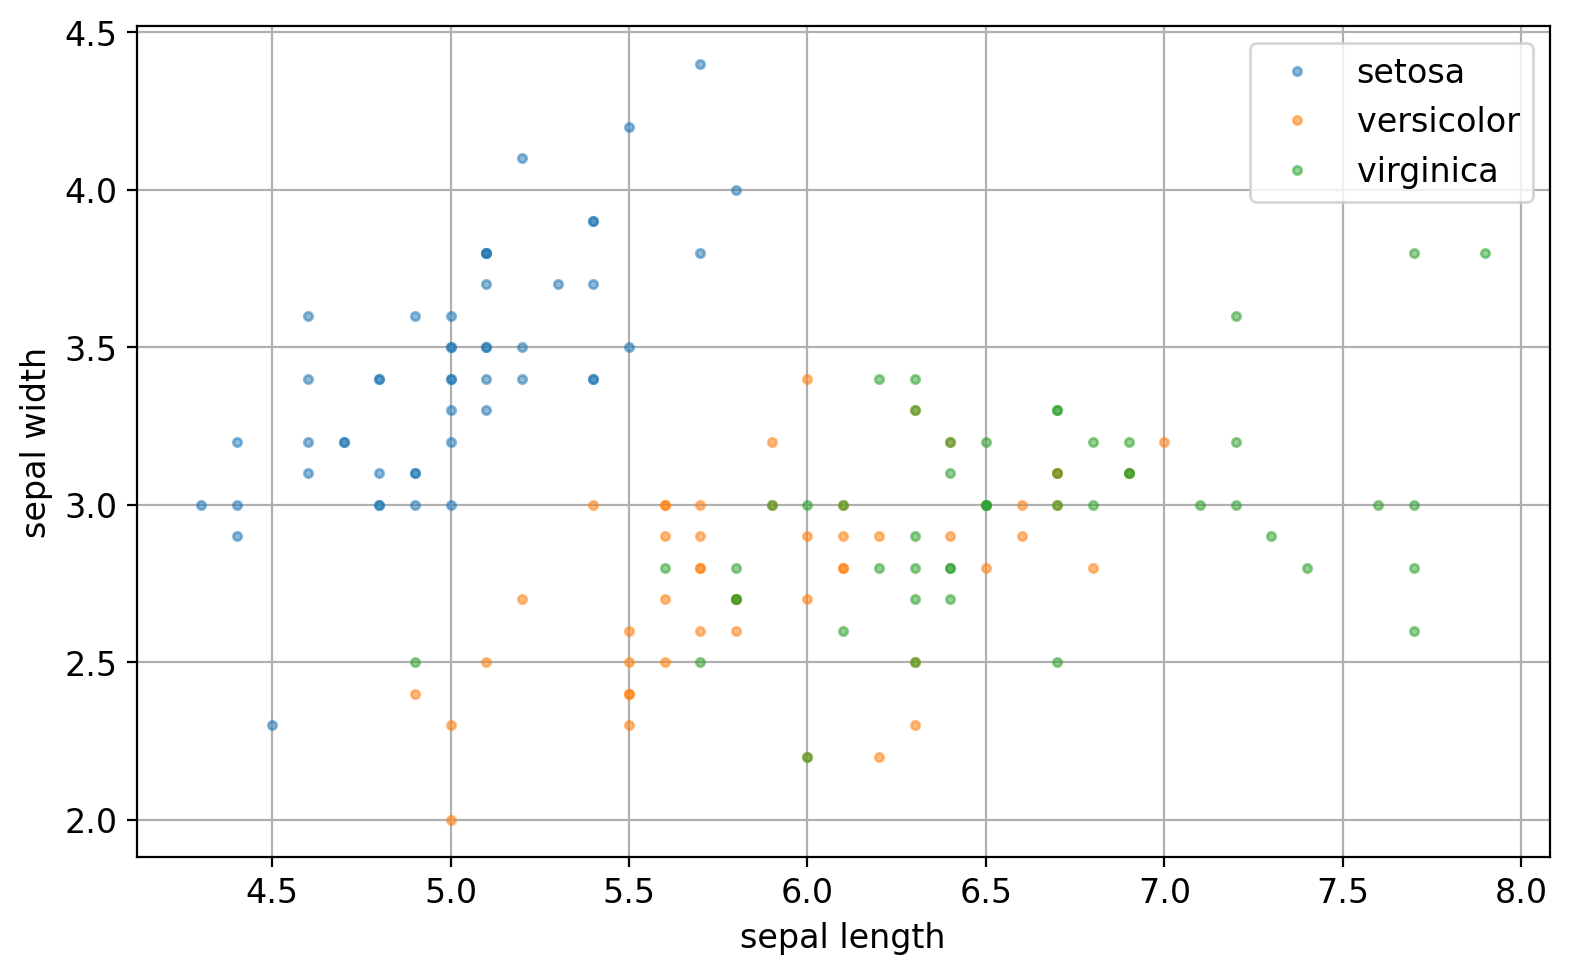
4.5.10. A Simple Plotting#
fig, axs = plt.subplots(1, 1, figsize=(8, 5), sharex=False, sharey=False, gridspec_kw=None)

for name, g in grouped:
    axs.plot(g["sepal_length"], g["sepal_width"], '.', alpha=0.5, label=name)

axs.legend(loc=1)
axs.grid()
axs.set(xlabel="sepal length", ylabel="sepal width")
plt.tight_layout()
plt.show()