import numpy as np
import matplotlib.pyplot as plt
import astroapers as aapWedge aperture sums for comet jets
This tutorial builds a synthetic comet-like image with three components:
- a compact point source;
- a circular coma with surface brightness proportional to \(r^{-1.5}\);
- an asymmetric jet centered near \(30^\circ\) whose brightness fades as \(r^{-2}\).
The goal is to show how WedgeAp can measure directional excess flux in an annular region. This is an aperture-sum workflow, not a complete comet photometry pipeline: background subtraction, PSF modeling, and physical dust modeling remain user-level analysis steps.
Make a synthetic comet image
astroapers angles are radians measured counterclockwise from the positive image x axis. The jet below is centered at theta_jet = 30 deg.
ny, nx = 70, 70
y, x = np.mgrid[:ny, :nx]

x0, y0 = 28.4, 28.7
dx = x - x0
dy = y - y0
r = np.hypot(dx, dy)
theta = np.arctan2(dy, dx)


# Component 1: unresolved nucleus/point source, represented here by a Gaussian.
point_source = 50.0 * np.exp(-0.5 * r**2 / 1.5**2)

# Component 2: circular coma. The softening avoids a singular central pixel.
coma = 100.0 / (r + 1.5) ** 1.5

# Component 3: asymmetric jet centered at 30 degrees with finite angular width.
theta_jet = np.deg2rad(30.0)
jet_width = np.deg2rad(10.0)
angle_offset = np.angle(np.exp(1j * (theta - theta_jet)))
angular_profile = np.exp(-0.5 * (angle_offset / (0.5 * jet_width)) ** 2)
radial_profile = 20.0 / (r + 1.0) ** 0.5
jet = radial_profile * angular_profile * (r > 2.0)

rng = np.random.default_rng(20250501)
background = rng.poisson(np.sqrt(6.0), size=(ny, nx))
noise = rng.normal(scale=0.3, size=(ny, nx))
data = background + point_source + coma + jet
data += rng.poisson(np.sqrt(data), size=(ny, nx)) + noise
fig, axes = plt.subplots(1, 4, figsize=(12, 3), constrained_layout=True)
for ax, image, title in [
(axes[0], point_source, "point source"),
(axes[1], coma, r"$r^{-1.5}$ coma"),
(axes[2], jet, r"$r^{-0.5}$ jet"),
(axes[3], data, "synthetic image"),
]:
im = ax.imshow(image, origin="lower", cmap="viridis", vmin=0, vmax=50)
ax.plot(x0, y0, "w+", ms=6)
ax.set_title(title)
fig.colorbar(im, ax=ax, fraction=0.046)
plt.show()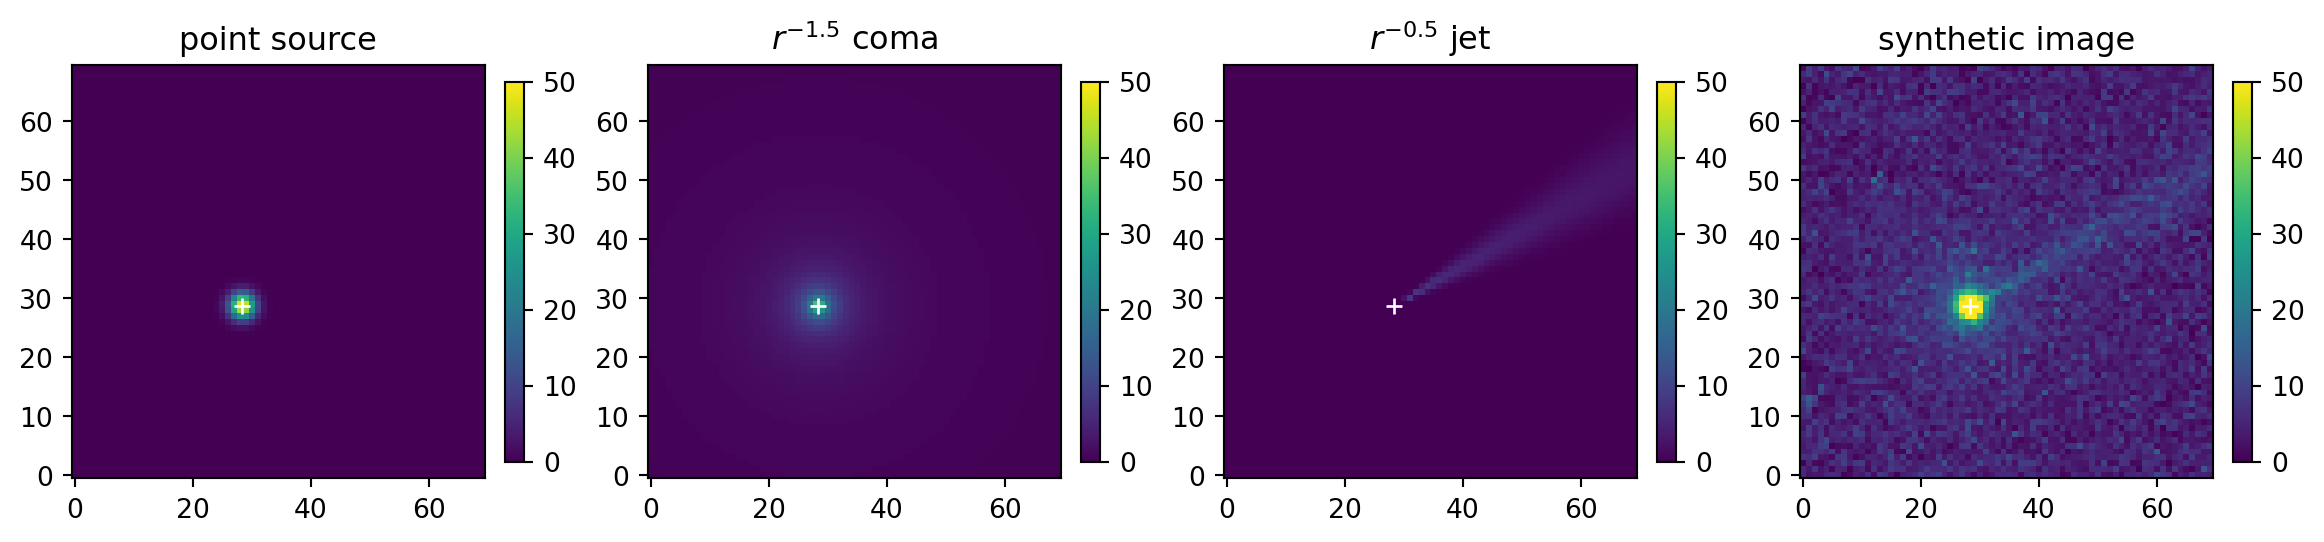
Measure one wedge aperture
The wedge excludes the innermost point-source dominated pixels and sums an annular sector around the expected jet direction.
r_in = 5.0
r_out = 25.0
dtheta = np.deg2rad(20.0)

jet_ap = aap.WedgeAp((x0, y0), r_in, r_out, theta_jet, dtheta)
jet_apsum, jet_npix = jet_ap.apsum_exact(data)

an = aap.CircAn((x0, y0), 30, 40)
an_weights = an.weights_center()[0]  # use "center" for full pixels
an_bbox = an.bboxes()[0]
msky = np.nanmedian(an_bbox.weighted_values(an_weights, data))

jet_srcsum = jet_apsum - msky * jet_npix

print(f"jet_apsum : {jet_apsum:.3f}")
print(f"jet_npix  : {jet_npix:.3f}")
print(f"msky      : {msky:.3f}")
print(f"jet_srcsum: {jet_srcsum:.3f}")
jet_apsum : 987.237
jet_npix : 104.720
msky : 4.569
jet_srcsum: 508.736For a quick visual check, overlay the aperture outline.
fig, ax = plt.subplots(figsize=(5, 4))
ax.imshow(data, origin="lower", cmap="viridis", vmin=0, vmax=50)
jet_ap.plot(ax=ax, color="r", lw=1.5)
an.plot(ax=ax, color="w", lw=1.5)
ax.set_title("WedgeAp & CircAn around the comet")
plt.show()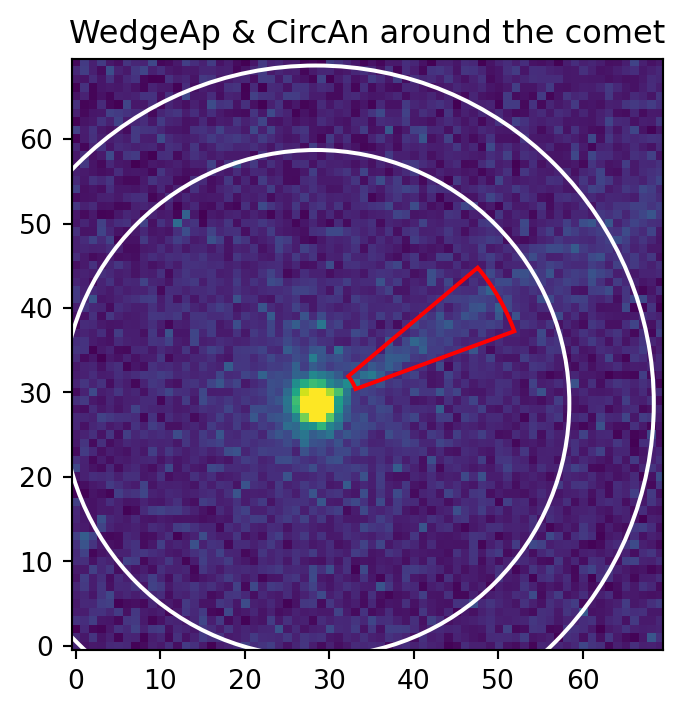
Scan position angle
A common wedge-photometry pattern is to evaluate the same annular wedge at many position angles. The peak indicates the angle with the largest directional excess.
angles_deg = np.arange(0.0, 360.0, 2.0)
angles_rad = np.deg2rad(angles_deg)
raw_sums = np.empty_like(angles_rad)
npix = np.empty_like(angles_rad)

for i, angle in enumerate(angles_rad):
    ap = aap.WedgeAp((x0, y0), r_in, r_out, angle, dtheta)
    raw_sums[i], npix[i] = ap.apsum_exact(data)

excess = raw_sums - msky * npix
best = np.argmax(excess)

angles_deg[best], np.rad2deg(theta_jet)
(np.float64(30.0), np.float64(29.999999999999996))fig, ax = plt.subplots(figsize=(7, 3))
ax.plot(angles_deg, excess, lw=1.5)
ax.axvline(np.rad2deg(theta_jet), color="C3", ls="--", label="input jet angle")
ax.axvline(angles_deg[best], color="k", ls=":", label="measured peak")
ax.set_xlabel("wedge center angle (deg from +x)")
ax.set_ylabel("sum - msky * npix")
ax.legend()
plt.show()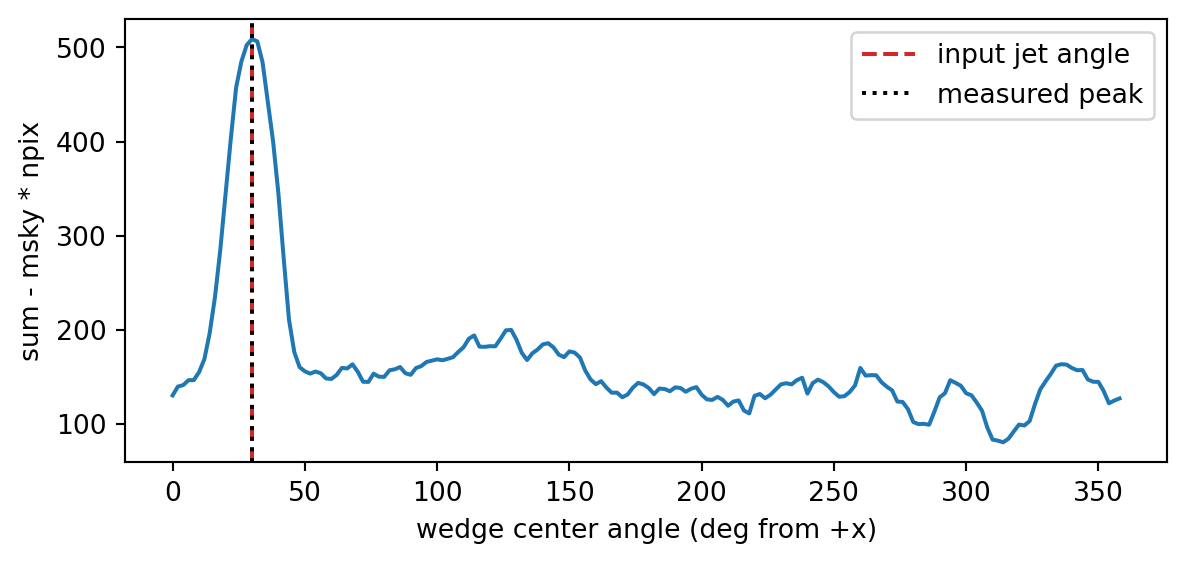
The base level is higher than zero because the wedge includes some coma flux. In a real comet analysis, subtract or model the coma before interpreting the angular excess as jet flux.
Center mode and caveats
apsum_center() assigns each pixel by its center. For large wedges this is a fast approximation that often gives a similar result to apsum_exact().
center_apsum, center_npix = jet_ap.apsum_center(data)

print(f"center_apsum: {center_apsum:.3f}")
print(f"apsum_exact: {jet_apsum:.3f}")
print(f"center_npix : {center_npix:.3f}")
print(f"npix_exact : {jet_npix:.3f}")
center_apsum: 988.763
apsum_exact: 987.237
center_npix : 105.000
npix_exact : 104.720apsum_exact() computes analytic fractional pixel overlap. Constant wedges like the examples above use a fast sector path; generalized wedges connect the inner and outer arc endpoints with straight sides and are also evaluated analytically. Use exact mode when fractional overlap is scientifically necessary; otherwise prefer apsum_center() for exploratory scans and large position-angle sweeps.
tapered = aap.WedgeAp(
    (x0, y0),
    r_in,
    r_out,
    theta_jet,
    np.deg2rad(8.0),
    theta_out=theta_jet + np.deg2rad(6.0),
    dtheta_out=np.deg2rad(24.0),
)

# Exact generalized wedges are available, but center mode is still faster.
tapered_center_sum, tapered_center_npix = tapered.apsum_center(data)
tapered_exact_sum, tapered_npix_exact = tapered.apsum_exact(data)

np.array([tapered_center_sum, tapered_exact_sum, tapered_center_npix, tapered_npix_exact])
array([1011.60897005, 981.78199063, 114. , 111.85302763])Maximum Performance
Wedges currently expose raw bbox-tight weights rather than a fused raw apsum_wedge_* function. For maximum performance, import the raw Rust extension as aapr, call aapr.weights_*, and reduce the returned bbox-tight arrays yourself. For more raw-call patterns, inspect astroapers.kernels.
import astroapers._rust as aapr

raw_data = np.ascontiguousarray(data, dtype=np.float64)
xpos = np.ascontiguousarray([x0], dtype=np.float64)
ypos = np.ascontiguousarray([y0], dtype=np.float64)


def raw_weighted_sum(result):
    raw_weights, ixmins, ixmaxs, iymins, iymaxs = result
    shape = (iymaxs[0] - iymins[0], ixmaxs[0] - ixmins[0])
    weights = np.asarray(raw_weights[0], dtype=np.float64).reshape(shape)
    cutout = raw_data[iymins[0]:iymaxs[0], ixmins[0]:ixmaxs[0]]
    return np.sum(weights * cutout, dtype=np.float64), np.sum(weights, dtype=np.float64)


raw_center_sums = np.array(
    [
        raw_weighted_sum(
            aapr.weights_wedge_center(
                xpos,
                ypos,
                r_in,
                r_out,
                angle,
                dtheta,
                angle,
                dtheta,
            )
        )[0]
        for angle in angles_rad
    ]
)

raw_exact_sum, raw_exact_npix = raw_weighted_sum(
    aapr.weights_wedge_exact(
        xpos,
        ypos,
        r_in,
        r_out,
        theta_jet,
        dtheta,
        theta_jet,
        dtheta,
    )
)

assert np.allclose(raw_exact_sum, jet_apsum)
assert np.allclose(raw_exact_npix, jet_npix)

np.rad2deg(angles_rad[np.argmax(raw_center_sums - np.median(raw_center_sums))])
np.float64(32.0)