import astroapers as aap
import numpy as np
from astropy.nddata import CCDData
from matplotlib import pyplot as plt

from astroimred.phot.apphot import apphot_annulus

y, x = np.mgrid[:33, :33]
data = 50.0 + 500.0 * np.exp(-((x - 16) ** 2 + (y - 16) ** 2) / (2 * 1.5**2))
ccd = CCDData(data, unit="adu")
aperture = aap.CircAp((16, 16), r=4)
annulus = aap.CircAn((16, 16), r_in=7, r_out=10)Measure a source with a sky annulus
Use astroapers geometry and astroimred photometry on a synthetic source.
Construct the source aperture and background annulus in image coordinates, then pass them to apphot_annulus. This example uses a synthetic Gaussian source with a constant background.
1. Define the image and apertures
Positions are (x, y) pixel centers. The aperture radius determines which source light contributes; the annulus estimates the local sky.
2. Measure background-subtracted flux
photometry = apphot_annulus(
    ccd,
    aperture,
    annulus,
    gain=1.5,
    rdnoise=3.0,
    t_exposure=30.0,
)
assert np.all(photometry["srcsum"] > 0)
photometry[["srcsum", "mag"]]| srcsum | mag | |
|---|---|---|
| 0 | 6836.235236 | -5.894239 |
The supplied gain is in electrons per ADU, read noise is in electrons, and exposure time is in seconds. mag is an instrumental magnitude; no calibrated photometric zero point is supplied in this example.
3. Inspect the geometry
fig, ax = plt.subplots(figsize=(5, 4), layout="constrained")
image = ax.imshow(data, origin="lower", cmap="gray")
aperture.plot(ax=ax, color="tab:orange")
annulus.plot(ax=ax, color="tab:blue")
ax.set(xlabel="x [pixel]", ylabel="y [pixel]")
fig.colorbar(image, ax=ax, label="Signal [ADU]")
plt.show()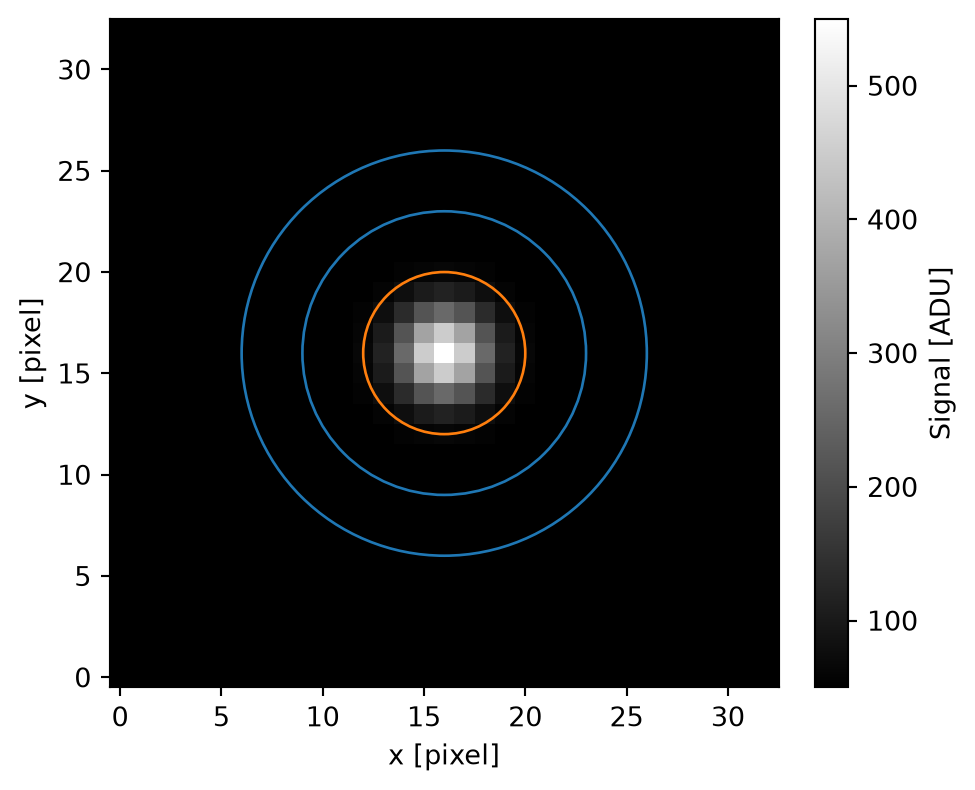
For masks, error arrays, multiple sources, and return columns, use the apphot_annulus reference. See astroapers tutorials for alternate aperture shapes and reusable weights.