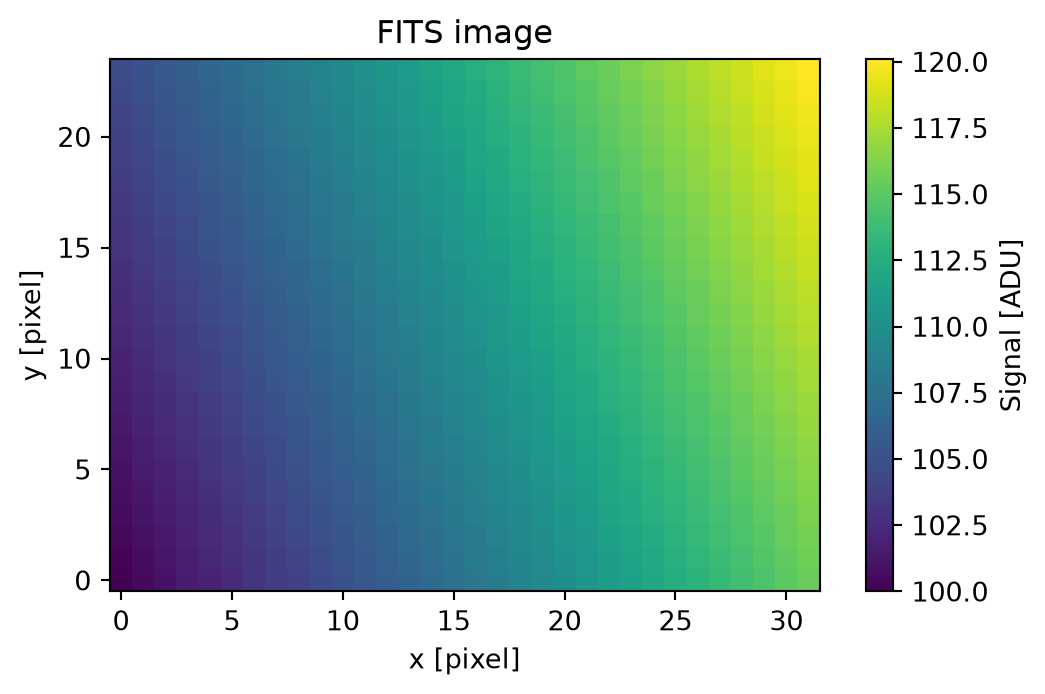
Run this example with astroimred[full]. It uses a temporary directory and synthetic data; it does not require telescope files or a network connection.
1. Create and read an image
from pathlib import Path
from tempfile import TemporaryDirectory

import numpy as np
from astropy.io import fits
from matplotlib import pyplot as plt

import astroimred as air

y, x = np.mgrid[:24, :32]
data = (100 + 0.5 * x + 0.2 * y).astype("float32")
header = fits.Header({"BUNIT": "adu", "OBJECT": "example", "EXPTIME": 30.0})

with TemporaryDirectory() as directory:
    path = Path(directory) / "example.fits"
    fits.writeto(path, data, header)
    ccd = air.load_ccd(path)
    summary = air.fits_summary([path], keywords=["OBJECT", "EXPTIME"])

np.testing.assert_array_equal(ccd.data, data)
ccd.shape, str(ccd.unit)
The returned CCDData keeps data, metadata, and units together. The temporary FITS file is removed after reading; ccd and summary remain available.
3. Display and bin pixels
fig, ax = plt.subplots(figsize=(6, 3.5), layout="constrained")
image = ax.imshow(ccd.data, origin="lower", cmap="viridis")
ax.set(xlabel="x [pixel]", ylabel="y [pixel]", title="FITS image")
fig.colorbar(image, ax=ax, label="Signal [ADU]")
plt.show()
binned = air.bin_ccd(ccd, factors=(2, 2))
assert binned.shape == (12, 16)
binned.shape
factors uses (x, y) order for two-dimensional images. The default bin operation is the mean; use binfunc=np.sum when summed pixels are intended.
Continue with image combination, or look up fits_summary and load_ccd.